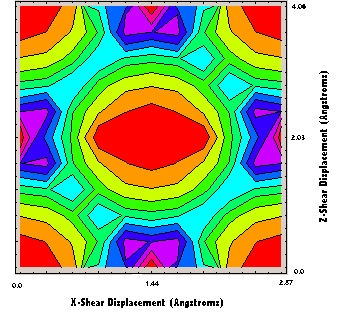
Figure 1 A contour plot of the data in Table 1. Red represents
low values and blue represents higher values. This plot was
created with Mathematica.
These simulations are important because they measure the energy to shear planes. When a plane is found to have a minimum energy, it can be considered a slip plane. Along these slip planes, dislocations can move with ease. The easier dislocations can move, the more ductile the material will be. The plane examined in this assignment was {110}. This plane is a natural slip plane for BCC iron.
Results
| 0 | 0.405879 | 0.811759 | 1.217638 | 1.623517 | 2.029396 | 2.435276 | 2.841155 | 3.247034 | 3.652914 | 4.058793 | |
| 0 | 5.86E-14 | 2.77E-03 | 1.16E-02 | 4.31E-02 | 5.03E-02 | 8.26E-02 | 5.03E-02 | 4.31E-02 | 1.16E-02 | 2.77E-03 | 5.86E-14 |
| 0.287 | 3.52E-03 | 6.27E-03 | 1.50E-02 | 3.05E-02 | 6.29E-02 | 6.02E-02 | 6.29E-02 | 3.05E-02 | 1.50E-02 | 6.27E-03 | 3.52E-03 |
| 0.574 | 1.44E-02 | 1.71E-02 | 2.58E-02 | 4.44E-02 | 3.59E-02 | 3.32E-02 | 3.59E-02 | 4.44E-02 | 2.58E-02 | 1.71E-02 | 1.44E-02 |
| 0.861 | 3.32E-02 | 3.59E-02 | 4.44E-02 | 2.58E-02 | 1.71E-02 | 1.44E-02 | 1.71E-02 | 2.58E-02 | 4.44E-02 | 3.59E-02 | 3.32E-02 |
| 1.148 | 6.02E-02 | 6.29E-02 | 3.05E-02 | 1.50E-02 | 6.27E-03 | 3.52E-03 | 6.27E-03 | 1.50E-02 | 3.05E-02 | 6.29E-02 | 6.02E-02 |
| 1.435 | 8.26E-02 | 5.03E-02 | 2.71E-02 | 1.30E-03 | 2.77E-03 | 5.86E-14 | 2.77E-03 | 1.30E-03 | 2.71E-02 | 5.03E-02 | 8.26E-02 |
| 1.722 | 6.02E-02 | 6.29E-02 | 3.05E-02 | 1.50E-02 | 6.27E-03 | 3.52E-03 | 6.27E-03 | 1.50E-02 | 3.05E-02 | 6.29E-02 | 6.02E-02 |
| 2.009 | 3.32E-02 | 3.59E-02 | 4.44E-02 | 2.58E-02 | 1.71E-02 | 1.44E-02 | 1.71E-02 | 2.58E-02 | 4.44E-02 | 3.59E-02 | 3.32E-02 |
| 2.296 | 1.44E-02 | 1.71E-02 | 2.58E-02 | 4.44E-02 | 3.59E-02 | 3.32E-02 | 3.59E-02 | 4.44E-02 | 2.58E-02 | 1.71E-02 | 1.44E-02 |
| 2.583 | 3.52E-03 | 6.27E-03 | 1.50E-02 | 3.05E-02 | 6.29E-02 | 6.02E-02 | 6.29E-02 | 3.05E-02 | 1.50E-02 | 6.20E-03 | 3.52E-03 |
| 2.87 | 5.86E-14 | 2.77E-03 | 1.16E-02 | 4.31E-02 | 5.03E-02 | 8.26E-02 | 5.03E-02 | 4.31E-02 | 1.16E-02 | 2.77E-03 | 5.86E-14 |
Figure 1 A contour plot of the data in Table 1. Red represents
low values and blue represents higher values. This plot was
created with Mathematica.
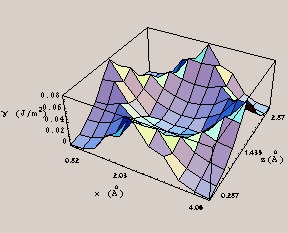
Figure 2 A three dimensional surface plot of the data in
Table 1. This plot was created by Mathematica.
If our values are compared to values in current literature,
such as Surface Science. It can be shown that our peak value of
surface energy, 0.0826 J/m2, is an order of magnitude lower
than the published value of 0.801 J/m2, for the {110} plane
and the <110> ledge.
References
Callister, William D., Jr. Materials Science and Engineering: an introduction. 3rd ed. John Wiley & Sons: New York, 1994.
Farkas, Diana, et al. "Atomistic Structure of Stepped Surfaces", Surface Science. Vol. 360, p. 282-288, 1996.
Kalpakjian, Serope Manufacturing Processes for Engineering Materials. 3rd ed. Addison Wesley Longman, Inc.: Menlo Park, CA, 1997