JWaveExecute object. The JWaveExecute class provides methods for setting and getting parameters (and data) and executing JWAVE wrapper functions on the server; however, a JWaveExecute object can only retrieve numerical and string data returned from the client. If you want your client to retrieve graphical information from the server, then you must use a JWaveView object.
Viewable object from the server. The Viewable object is returned by the JWAVE wrapper function automatically if the wrapper created some graphics (such as with the PLOT command). The JWaveCanvas class simply provides a canvas for displaying a Viewable object. Figure 4-1 shows a typical JWAVE scenario where graphical data is created on the server and returned to the client.
TIP: In this example, data is physically returned from the server to the client. A more efficient method of handling the data is with a data proxy object. For more information on data proxies, see Chapter 6, Managing Data.

Figure 4-1 A JWaveView object is used to obtain viewable image data from the PV-WAVE server
Viewable object returned from a JWAVE wrapper function. Remember that if the JWAVE wrapper generates graphics (for example, if the wrapper calls the PLOT procedure), then the wrapper automatically returns a Viewable object to the client application. The client application can then display the Viewable object with a JWaveCanvas object.
Example 4-1 JWaveCanvasused to display a Viewable object
// The JWaveCanvas object will display the Viewable object.
myCanvas = new JWaveCanvas();
// Create a JWaveView object for the myWrapper wrapper function.
myJWV = new JWaveView("myWrapper");
// Set the size of the Viewable object.
myJWV.setViewSize( myCanvas.getSize() );
try {
    // Execute the JWAVE wrapper function.
    myJWV.execute();
    // Specify the Viewable object to be displayed in this canvas.
    // The setViewable method also repaints the canvas with the
specified
    // Viewable object.
    myCanvas.setViewable( myJWV.getViewable() );
} catch (JWaveException ignore) { }
demonstration program
TIP: Example 4-2 (the client Java program) is similar to (but a simplified version of) the
ViewTest.java, which you can find in: 
VNI_DIR/classes/jwave_demos/tests

VNI_DIR\classes\jwave_demos\tests
SimpleView.java, can be found in:

VNI_DIR/classes/jwave_demos/doc_examples

VNI_DIR\classes\jwave_demos\doc_examples
SIMPLE_VIEW (the JWAVE wrapper), can be found in:

VNI_DIR/jwave-3_0/lib/user/simple_view.pro

VNI_DIR\jwave-3_0\lib\user\simple_view.pro
VNI_DIR is the main Visual Numerics installation directory.
 Extension of the JWaveExecute class, used for graphics.
 Creates a canvas to display a
 Viewable object.
 Contains any graphics returned from PV-WAVE.
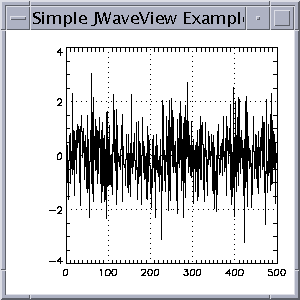
Example 4-2 SimpleView.java displays a 2D plot generated by PV-WAVE
import com.visualnumerics.jwave.*;
import java.awt.*;
import java.awt.event.*;

public class SimpleView {

   public static void main(String[] argsNotUsed) {
      SimpleView me = new SimpleView();
   }


   /** Construct application */
   public SimpleView() {

            Frame f = new Frame("Simple JWaveView Example");

            // so Exit button (window menu) will work
            f.addWindowListener( new WindowAdapter() {
                    public void windowClosing(WindowEvent e) {
                          System.exit(0);
                    }
          } );

      // Add a JWaveCanvas to the frame
      f.setSize(300,300);
      viewCanvas = new JWaveCanvas();
      f.add(viewCanvas);

      f.setVisible(true);

      // Make the plot, fill the canvas
      doPlot();
        }

   /** Canvas on which to draw */
   JWaveCanvas viewCanvas;

   /** Make plot on canvas */
   public void doPlot() {

      try {
                  // Use SIMPLE_VIEW wrapper function
                  JWaveView command = new JWaveView("SIMPLE_VIEW");

                  // Set view size same as canvas
                  command.setViewSize( viewCanvas.getSize() );

                // Set some colors and parameters
                command.setNamedColor("BACKGROUND", Color.white);
                command.setNamedColor("COLOR", Color.black);

                command.setParam("GRIDSTYLE", 1); // dotted lines for grid
                command.setParam("TICKLEN", 0.5); // full grid
                command.setParam("Y", 500); // Number of data points

                // Execute the command
                command.execute();

                // Retrieve the Viewable and give it to the JWaveCanvas
                // JWaveCanvas repaints when it gets a new Viewable
                viewCanvas.setViewable( command.getViewable() );

                // Close connection, as we are done with the session
                command.getConnection().shutdown();

      } catch (Exception e) {
                  System.out.println(e);
      }
        }
}
Example 4-3 JWAVE wrapper simple_view.pro
FUNCTION SIMPLE_VIEW, client_data
   ; Retrieve parameter data
   n = GETPARAM(client_data, 'Y', /Value, Default = 100)
   grid = GETPARAM(client_data, 'GRIDSTYLE', /Value, Default = 0)
   tick = GETPARAM(client_data, 'TICKLEN', /Value, Default = 0.2)
   back = GET_NAMED_COLOR('BACKGROUND', Default = '000000'xL)
   fore = GET_NAMED_COLOR('COLOR', Default = 'ffffff'xL)
   ; Generate some "data" - n points
   vals = RANDOMN(seed, n)
   ; Make the plot
   PLOT, vals, Ticklen = tick, GridStyle = grid, $
     Background = back, Color = fore
      ; Return the data (default data name DATA).
      ; Note that this data is returned in addition to the Viewable
object.
   RETURN, vals
END

Figure 4-2 The SimpleView plot is displayed on the client.
Viewable object. The default resize behavior is NOT_RESIZEABLE. This means that the Viewable object will always be drawn at its "natural" size (as generated by PV-WAVE), regardless of the size of the Component it is drawn into.You may want to use
Viewable.setPreferredResizeMode with either RESIZEABLE or PRESERVE_ASPECT if your Component is resizable. These modes allow the Viewable object to draw a scaled version of the plot into any size Component. The PRESERVE_ASPECT will resize the Viewable object, but only as much as is possible while maintaining the original (as generated by PV-WAVE) aspect ratio of the Viewable object.
Viewable object can use these to do coordinate transforms.The two methods
transformToPoint and transformToData can be used to transform between the plot's data coordinates and a java.awt.Point object.For example, to print the data coordinates where a user clicks on the plot, you might do the following:
  double[] d = myViewable.transformToData( theClickPoint );
  System.out.println( "Click at ("+ d[0] +", "+ d[1] +")" );
getDataBounds method. For example, to determine if a Point object is inside the plot bounds:
if ( myViewable.getDataBounds().contains( myPoint ) ) { ... }
transformToData method is only useful for plots with 2D data coordinates (that is, X vs. Y plots). To test for this condition, use the has2DCoordinates method.
TIP: For an example of using the coordinate transforms of the Viewable class, seeViewTest.javawhich you can find in:

VNI_DIR/classes/jwave_demos/tests

VNI_DIR\classes\jwave_demos\tests

VNI_DIR/classes/jwave_demos

VNI_DIR\classes\jwave_demos


